Intro to Power and Effect Sizes in Clinical Psychology Research
DClin Research Methods 1
Teesside University
Learning outcomes
- Understand the concept of statistical power
- Understand the concept of effect size
- Understand the relationship between power and effect size
- Understand the relationship between power and sample size
- Understand the relationship between effect size and sample size
Recall from last week:
One of the common issues with clinical research is that studies are underpowered.
Today we are going to look at Power and Effect Size, and how these relate to sample size.
Statistical significance, sample power and effect size are 3 inter-related concepts that are important to understand when designing a study.
What is statistical significance?
Does anyone remember what statistical significance is?
What is the null hypothesis?
The null hypothesis is the hypothesis that there is no difference between groups, or no relationship between variables.
For example, if we are comparing the mean score on a measure between two groups, the null hypothesis is that, in the population, the mean score on the measure is the same for both groups.
When we test hypotheses, we are trying to see if our data are compatible with the null hypothesis or not.
What is statistical significance?
- The term “statistical significance” is a shorthand term, used to describe the probability of obtaining a result as extreme as, or more extreme than, the result we obtained, if the null hypothesis were true.
In short: Statistical significance is a test of how compatible the data are with the null hypothesis. It does not tell us what our data proves, only that it is unlikely that the null hypothesis is true.
Imagine there is a population of 2000 people with a particular condition.
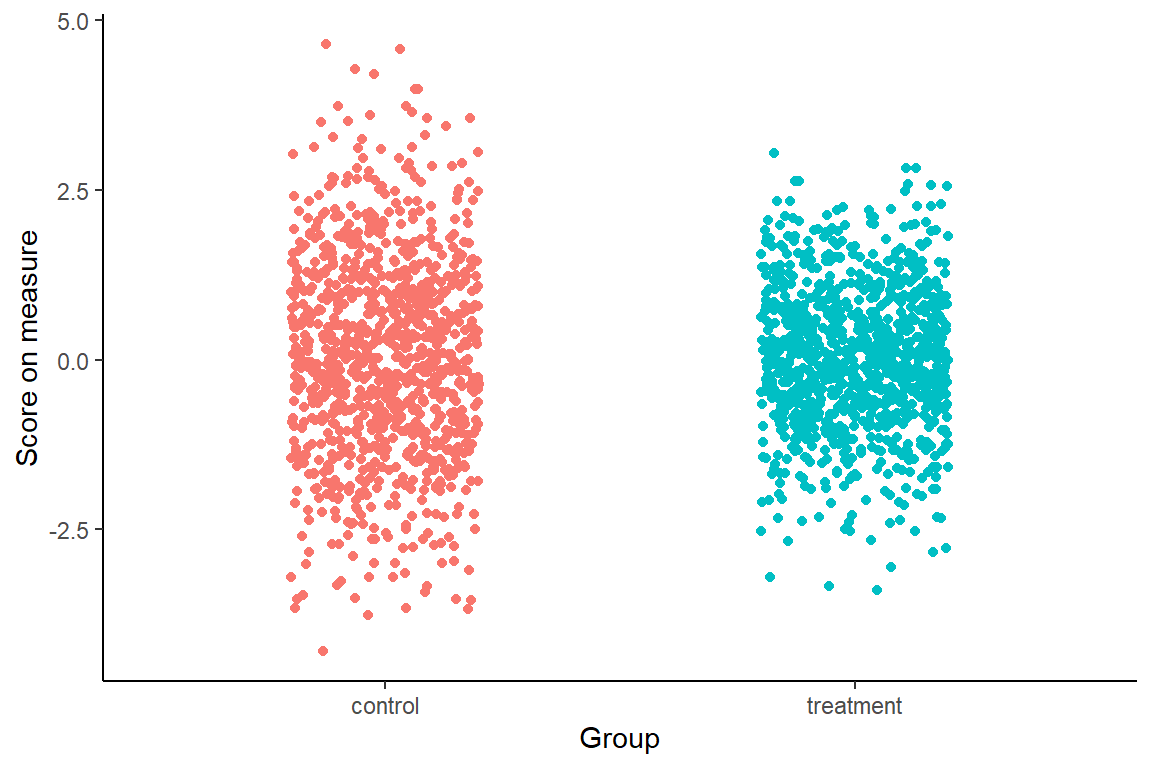
Imagine we could see them all, and knew that there was not much difference between those who received treatment and those who did not.
Now, imagine that 100 studies were done across the country, each with a sample size of 20 per group.
What would the results say?
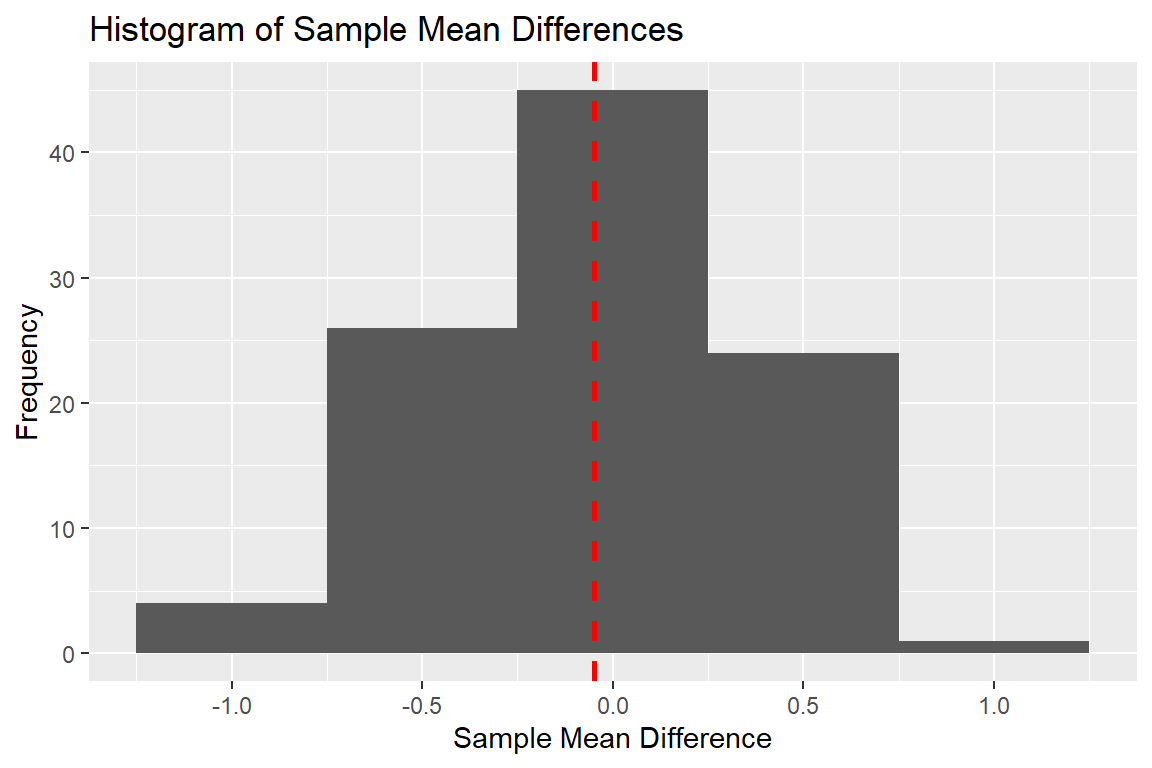
If a t-test was done on each of these samples, what would the results say?

What is statistical significance?
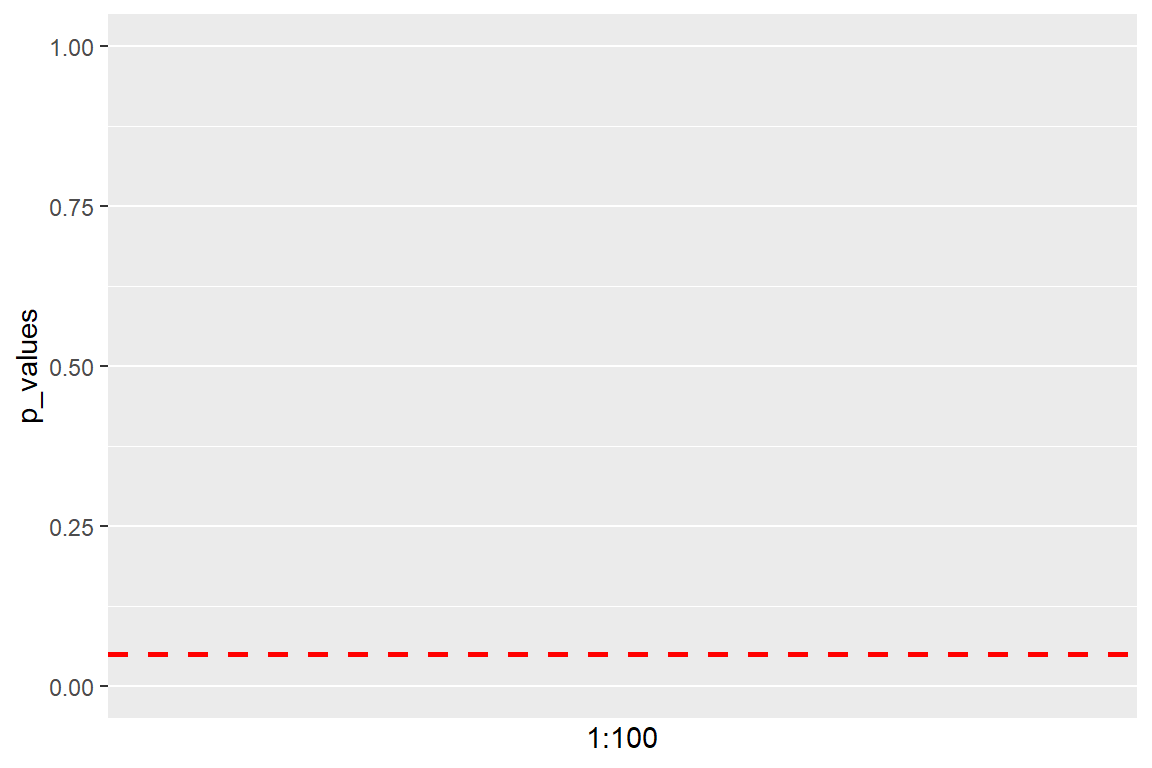
In psychological research, we usually use a p-value of 0.05 as the threshold for statistical significance.
This means that, even if the null hypothesis were true, if we were to repeat the study 100 times, we could still find a “extreme” difference, 5 times (5% of the time).
This is 5% threshold is an arbitrary choice, and is not used for any theoretical reason.
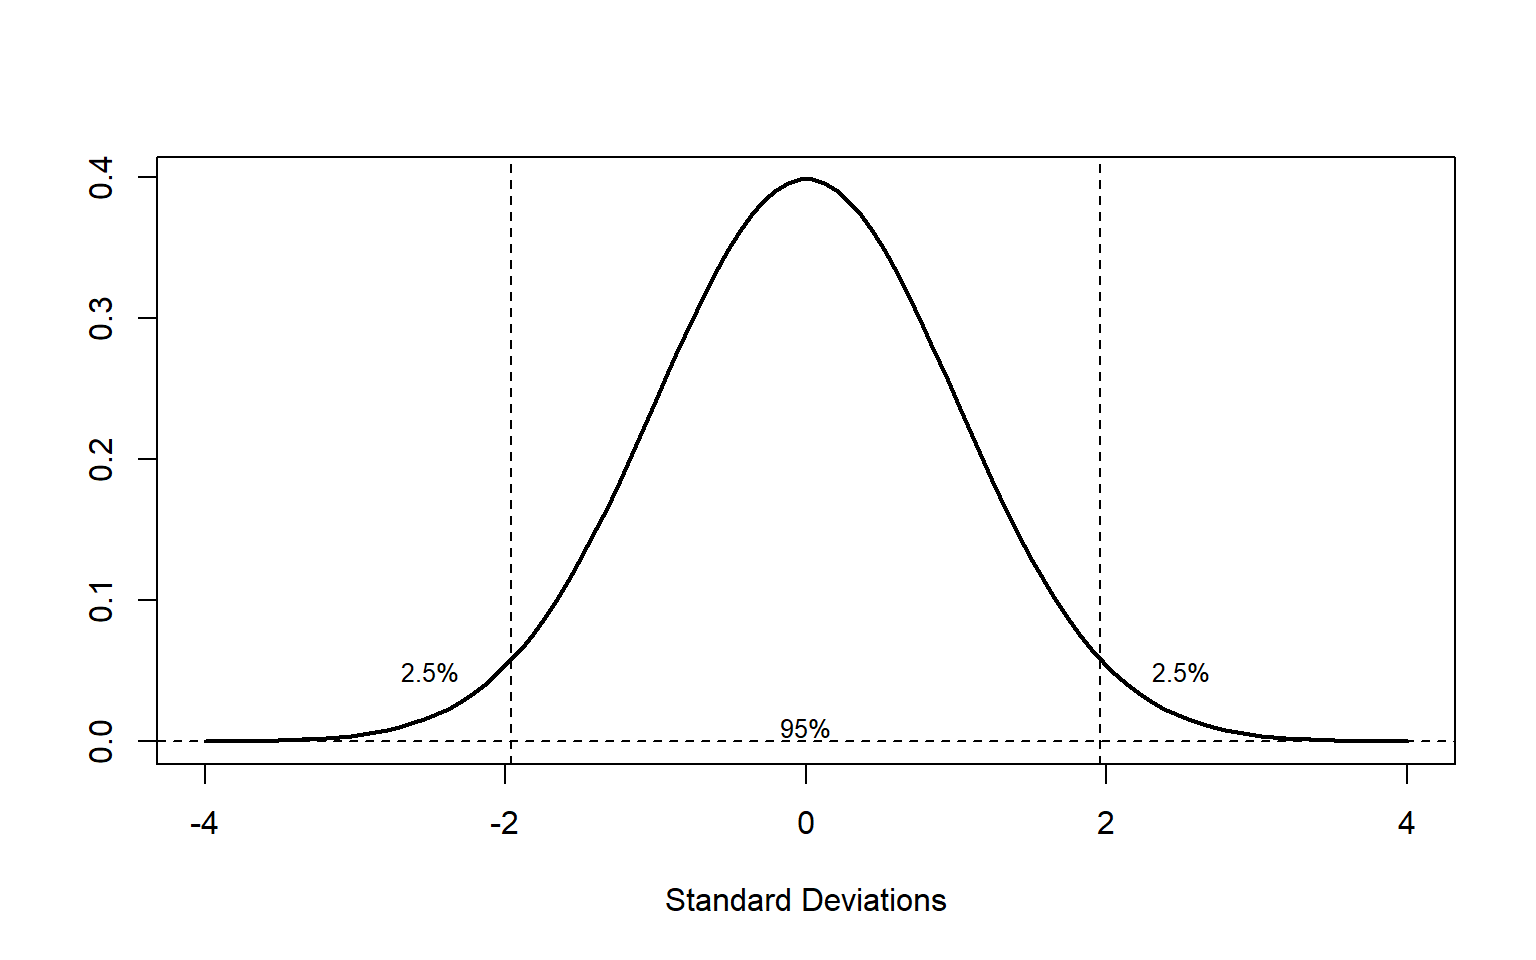
For example: for a difference between 2 means, we could still obtain a difference of up to 1.96 standard deviations, 95% of the time, even if the null hypothesis were true.
There’s still a 5% chance (2.5% + 2.5%) of obtaining a difference higher than 1.96 standard deviations, even if the null hypothesis were true.
Small samples and p values
Small samples increase the likelihood of false positives (significant results that don’t reflect the population)
This is because the true pattern in the population is not perfectly reflected in small samples.
Within small samples, there will be random variation that can lead to differences between groups.
Takeaways
Even when the null hypothesis is true, we can still obtain a range of differences when we sample from the population.
Some of these differences will even result in p-values below 0.05.
It’s important to recognise that false positives (Type 1 error) can happen. Smaller samples are subject to more random variation and lack of control in study design can lead to spurious conclusions.
The problem with statistical significance
“It’s science’s dirtiest secret: The ‘scientific method’ of testing hypotheses by statistical analysis stands on a flimsy foundation.”
In February 2014, George Cobb, Professor Emeritus of Mathematics and Statistics at Mount Holyoke College, posed these questions to an ASA discussion forum:
Q: Why do so many colleges and grad schools teach p = 0.05?
A: Because that’s still what the scientific community and journal editors use.
Q: Why do so many people still use p = 0.05?
A: Because that’s what they were taught in college or grad school.
What is the problem with statistical significance?
“Researchers commonly use p-values to answer the question: How strongly does the evidence favor the alternative hypothesis relative to the null hypothesis? p-Values themselves do not directly answer this question and are often misinterpreted” (Benjamin & Berger, 2019)
The ASA statement on p-values
- P-values can indicate how incompatible the data are with a specified statistical model.
- P-values do not measure the probability that the studied hypothesis is true, or the probability that the data were produced by random chance alone.
- Scientific conclusions and business or policy decisions should not be based only on whether a p-value passes a specific threshold.
- Proper inference requires full reporting and transparency.
- A p-value, or statistical significance, does not measure the size of an effect or the importance of a result.
- By itself, a p-value does not provide a good measure of evidence regarding a model or hypothesis.
Takeaways
p-values can put people into a binary mindset about results (yes/no) when the data collected is likely more complex
p-values are not stable from one study to the next, so be careful about interpreting them.
p-values are not a good measure of evidence for or against a hypothesis, only how likely the data are to have occurred if the null hypothesis were true.
There is no such thing as a “near-significant” result. A p-value of 0.048 is not more “important” than a p-value of 0.05.
Confidence Intervals
P-values are not stable from one study to the next
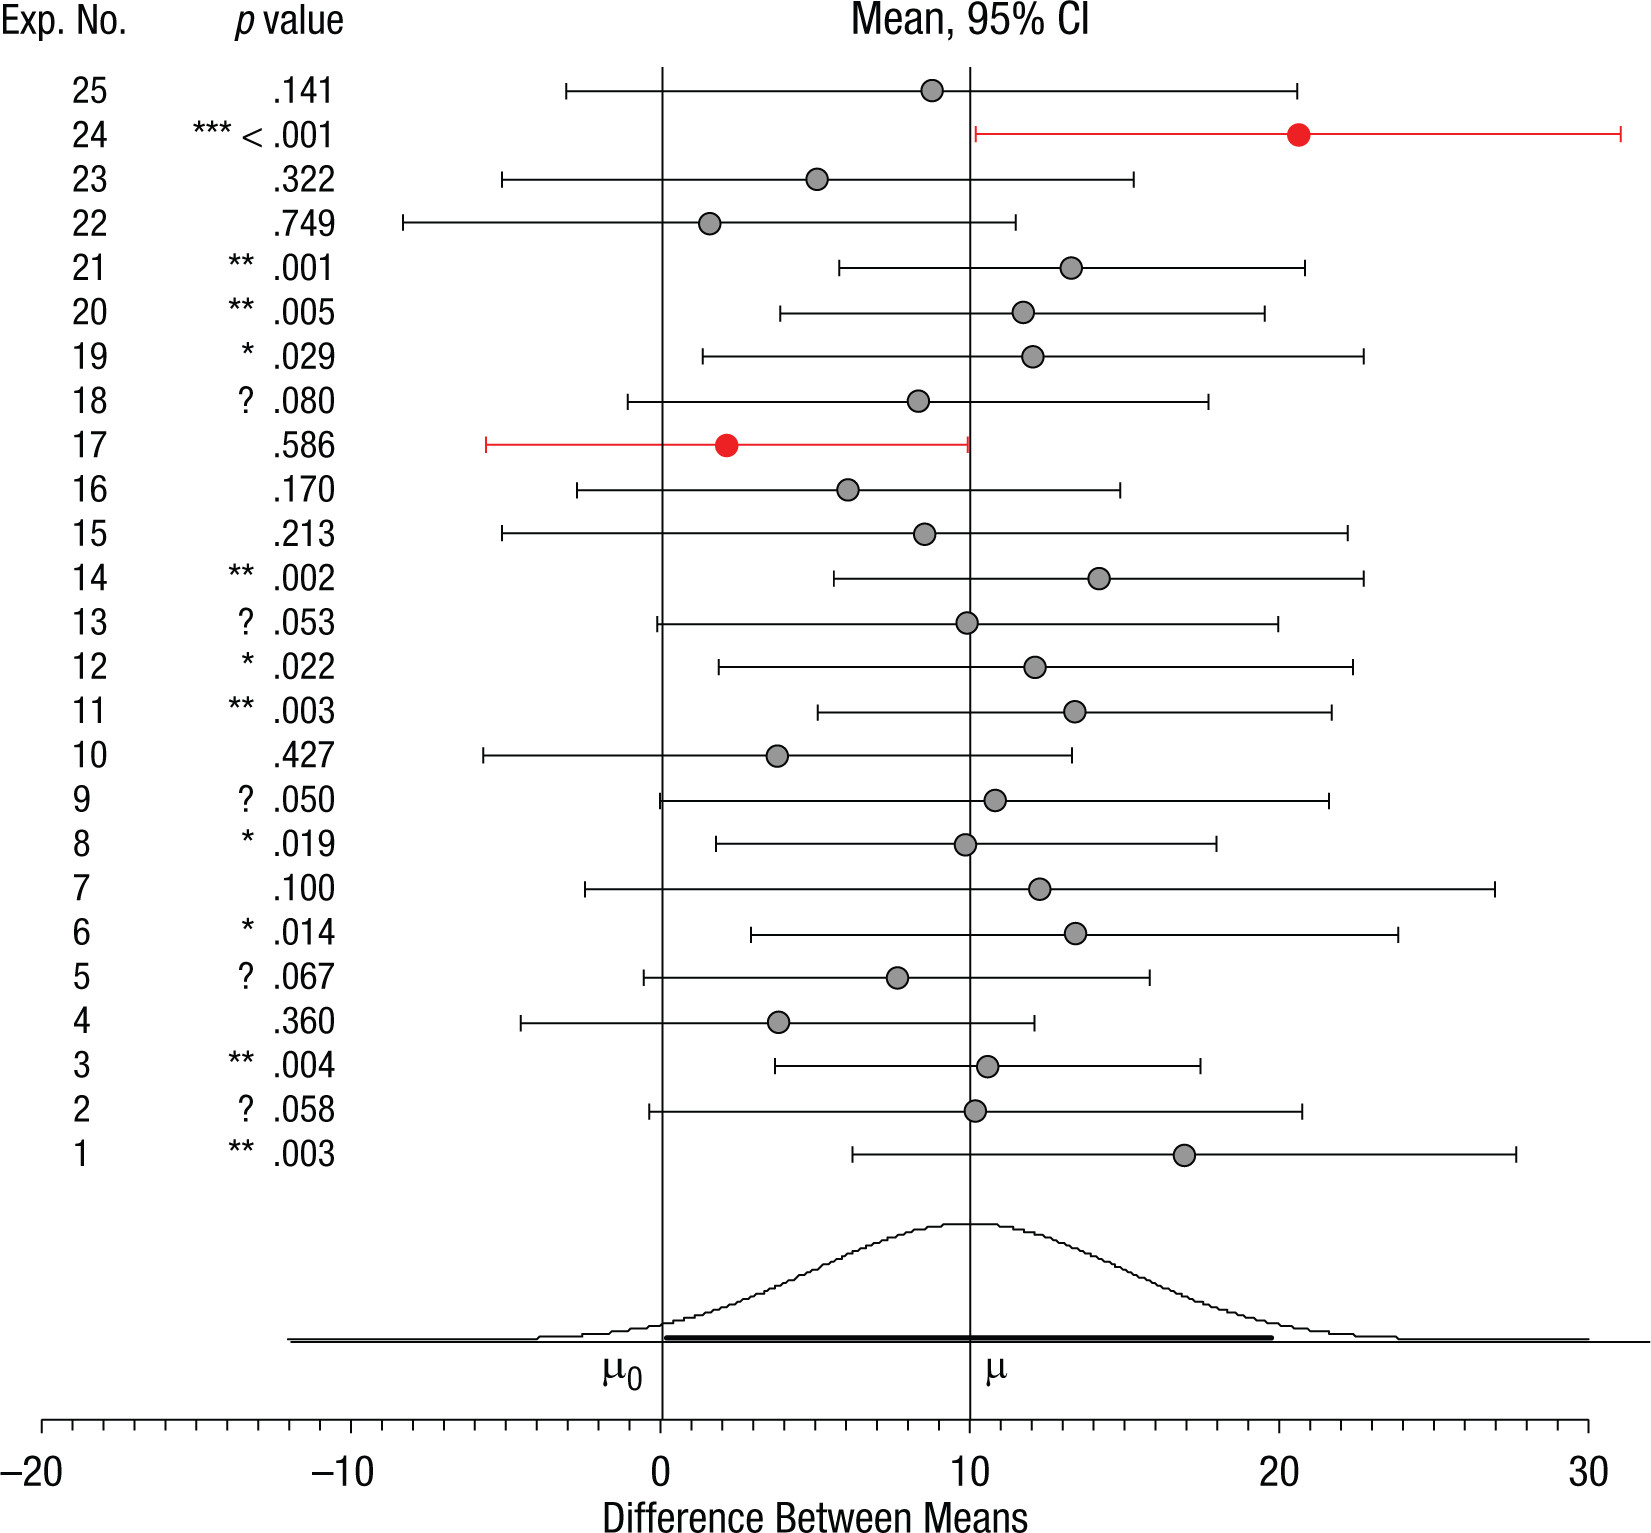
p-values and confidence intervals for 25 samples
Using confidence intervals to interpret results
- Confidence intervals are a better way to interpret results than p-values.
- A confidence interval is a range of values that is likely to contain the true value of a parameter.
- For example, a 95% confidence interval for a mean says:
- If we were to collect the same sample 100 times and calculate a 95% confidence interval of the mean for each sample, 95 of the intervals would contain the true population mean.
What can confidence intervals tell us?
- Confidence intervals can a range of likely outcomes (if we were to conduct the study repeatedly). The wider they are, the less precise our estimate is.
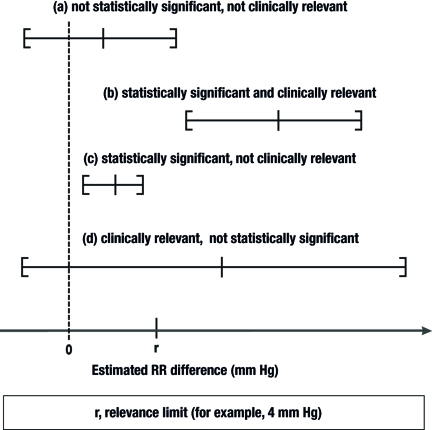
In a later class, Dr Alan Bowman will discuss clinically meaningful results
How do we report Confidence Intervals?
To report confidence intervals in APA style, we need to report the lower and upper bounds of the interval, and the confidence level.
For example:
The results of the t-test showed a significant difference between the two groups, t(18) = 2.43, p = .03, 95% CI [0.02, 0.45].
This tells us that the true mean difference between the two groups is likely to be between 0.02 and 0.45. We can decide (depending on our research question) how meaningful this is to us.
Takeaways
p-values are not a good measure of the size of an effect or the importance of a result.
Confidence intervals are a better way to interpret results than p-values.
Confidence intervals can tell us the likely range of outcomes, and a better sense of how precise our estimate of the true value is.
Let’s look again at the data:
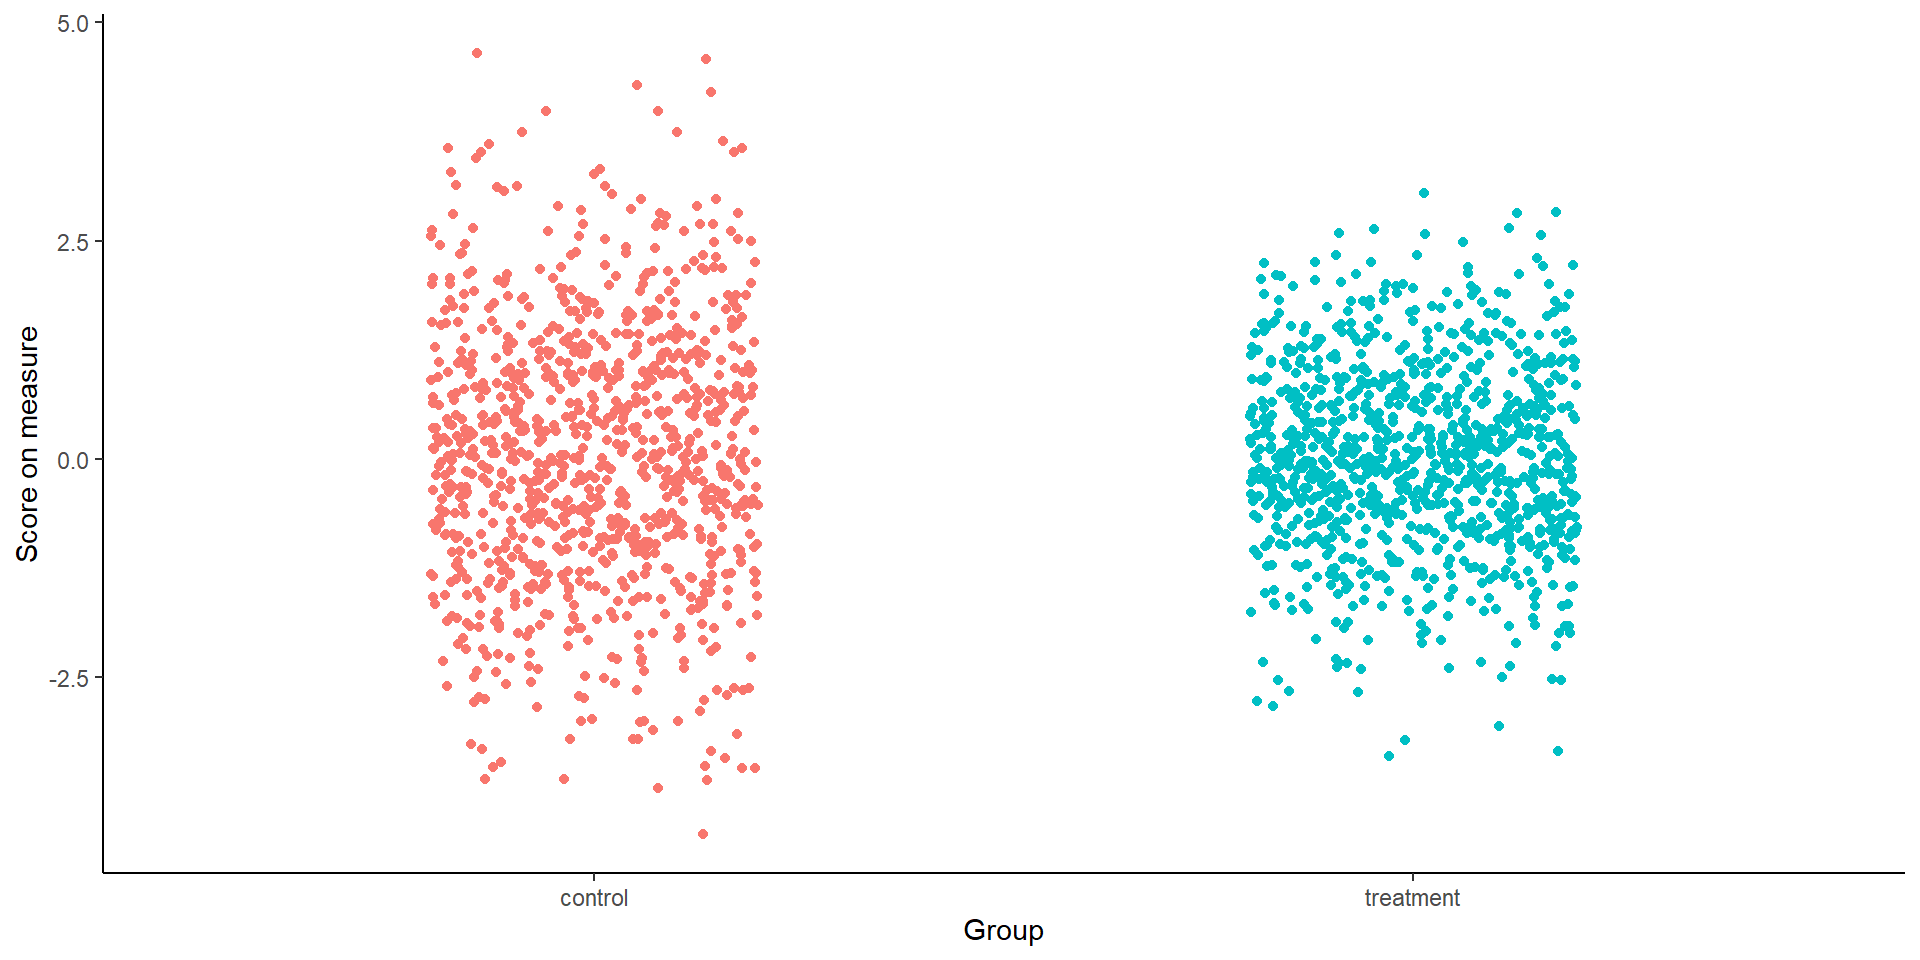
There’s not much difference between the two groups. Does that mean there is no difference?
Effect sizes and designing studies with sufficient power
Significance does not mean importance
- Over the last several decades, psychology research has become too focused on statistical significance.
- A statistically significant result does not mean that the result is meaningful or important.
- The focus on statistical significance has led to a number of problems:
- P-hacking
- Publication bias
- Questionable research practices (small sample sizes, etc.)
What is effect size?
- When we conduct research, we are usually asking a question about a difference or a relationship.
- For example, we might be interested in whether there is a difference in the mean score on a measure between clinical two groups.
- Or we might be interested in whether there is a relationship between two variables.
- However, different studies use different samples and measures, and so the results of these studies are not directly comparable.
Effect size is a standardized measure of the magnitude of an effect
Which measure of effect size should I use?
- There are many measures of effect size, some of the most common are:
- Cohen’s d
- Pearson’s r
- Odds ratio
- Phi coefficient
- Eta squared
- R squared
- The choice of effect size measure depends on the type of study and the type of data collected.
Small, medium and large effect sizes?
Often people talk in terms of small, medium and large effect sizes. This is not very helpful, as it is not clear what these terms mean.
It is better to understand the literature in your field, and to know what effect sizes are typically found in studies similar to yours.
However, we need to be careful (Albers & Lakens, 2018):
effect size estimates from small studies are inaccurate
publication bias inflates effect sizes.
“Follow-up” bias, is an issue with people deciding whether or not to conduct studies based on the effects found in pilot data
Don’t use pilot data to estimate effect size
This can lead to seriously underpowered study designs, especially when the sample size of the pilot and/or the true effect size is small to medium.
Not only is this approach inaccurate, it is inefficient.
Instead:
- Determine the smallest effect size of interest (SESOI), based on either utility or theoretical arguments, and use the SESOI in an a-priori power analysis.
- Sequential analysis might be appropriate (Lakens, 2014)
- A “safeguard” power analysis can be used (underestimates the effect from published studies) (Perugini et al., 2014)
When designing a study, we need to ensure it has sufficient power
What does this mean?
- Power is ability to detect an effect if it exists
- If a study has low power, it is not possible for us to tell whether a statistically non-significant result is due to:
- The absence of an effect
- The absence of power to detect an effect
Think of power as the strength of magnification and effect size as the size of what you are looking for…

Thinking about statistical power
We first need to decide what effect size we are interested in detecting. This can be called the smallest effect size of interest (SESOI).
We then need to decide how much power we want to have to detect this effect size.
A common choice is 80% power, but this is arbitrary. This means:
With the given effect size and the calculated sample size, we will be able to detect the effect (if it exists) 80% of the time.
Putting it all together…
Takeaways
Power is ability to detect an effect if it exists
Before conducting a study, we need to know what effect size we are interested in detecting
We need to ensure that our study has sufficient power to detect this effect size
Very large samples will show very small effects as statistically significant (but these may not be important)
Alternatives to Null Hypothesis Significance Testing
Different approaches
- Confidence intervals (focus on precision of estimates)
- Bayesian statistics (a focus on estimating parameters and updating beliefs based on data)
- Estimation statistics (focus on effect sizes and confidence intervals)
- E-values (focus on the evidence for or against a hypothesis)
We will learn how to calculate effect size, confidence intervals and power in R
References
![]()