Topic 7 Correlation
7.1 What is Correlation?
- The relationship between 2 variables
- Question: Is treatment duration related to aggression levels?
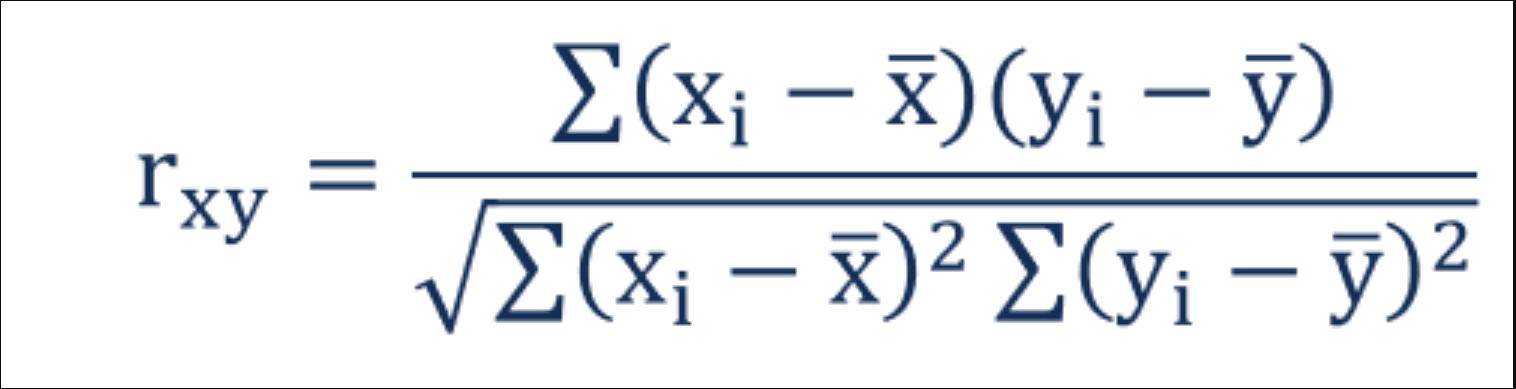
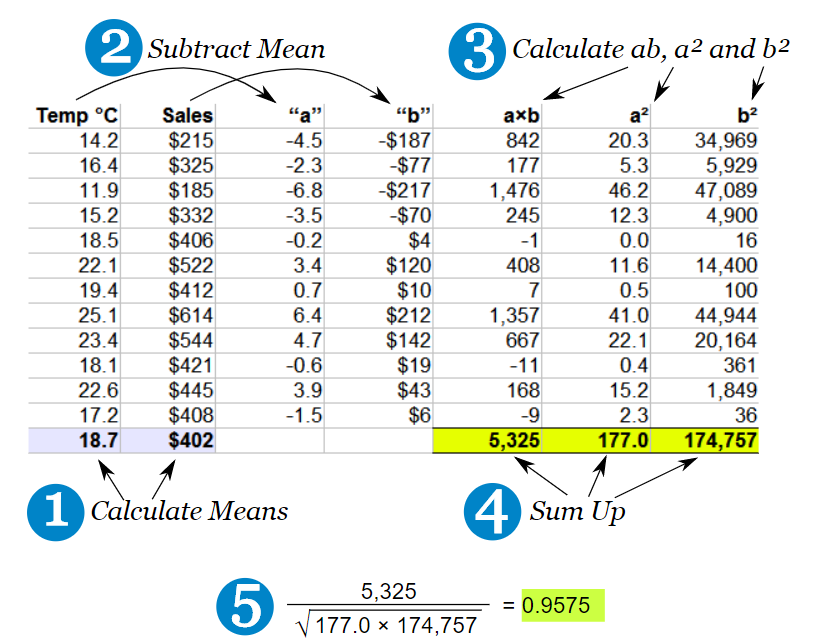
7.2 How is correlation calculated?
- Think of this as covariance divided by individual variance
- If the changes are consistent with both variables, the final value will be higher
7.3 Running correlation in R
- Step 1: Check assumptions
- Data,distribution,linearity
- Step 2: Run correlation
- Step 3: Check R value
- Step 4: Check significance
7.3.1 Check assumptions: data
- Parametric tests require interval or ratio data
- If the data are ordinal then a non-parametric correlation is used
What type of data are treatment duration and aggression level?
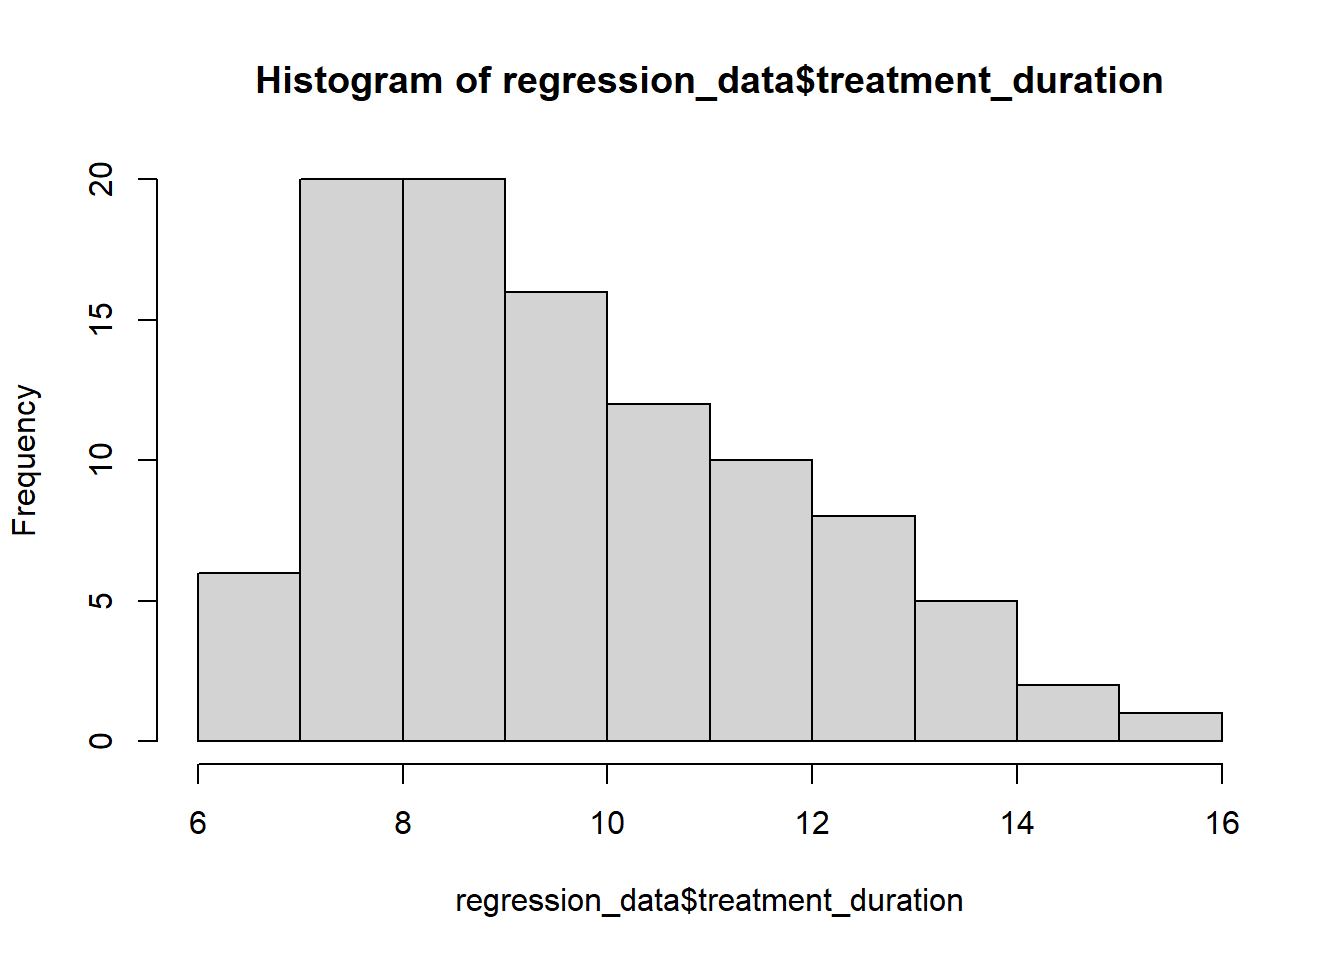
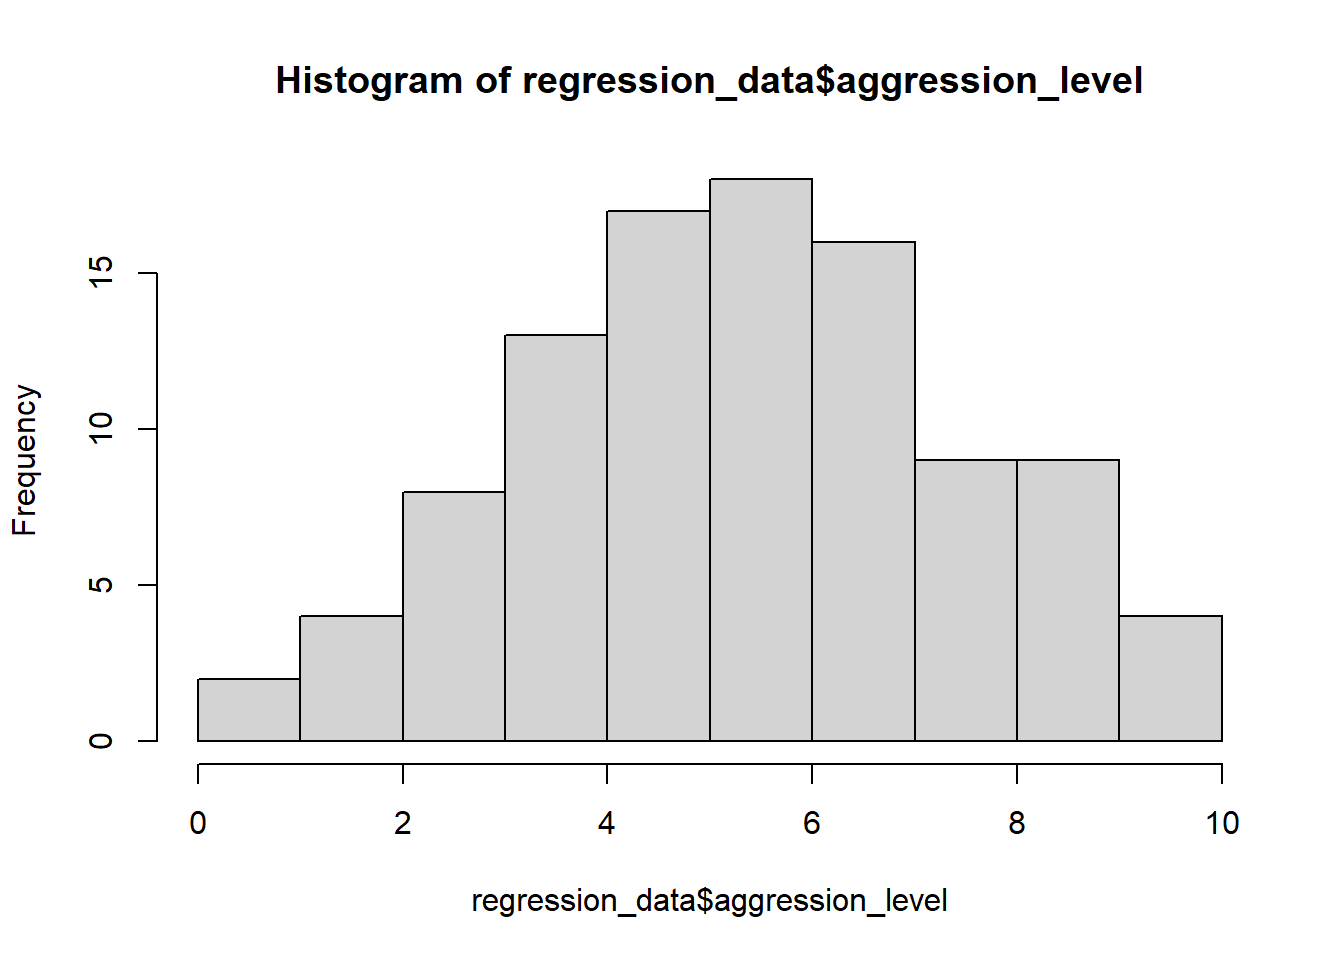
7.3.3 Check assumptions: distribution #2
- Parametric tests require normally distributed data
shapiro.test(regression_data$treatment_duration)##
## Shapiro-Wilk normality test
##
## data: regression_data$treatment_duration
## W = 0.94971, p-value = 0.0007939shapiro.test(regression_data$aggression_level)##
## Shapiro-Wilk normality test
##
## data: regression_data$aggression_level
## W = 0.9928, p-value = 0.8756- The normality assumption is less of an issue when sample size is > 30
7.3.4 Checking assumptions: linearity
regression_data %>% ggplot(aes(x=treatment_duration,y=aggression_level)) +
  geom_point()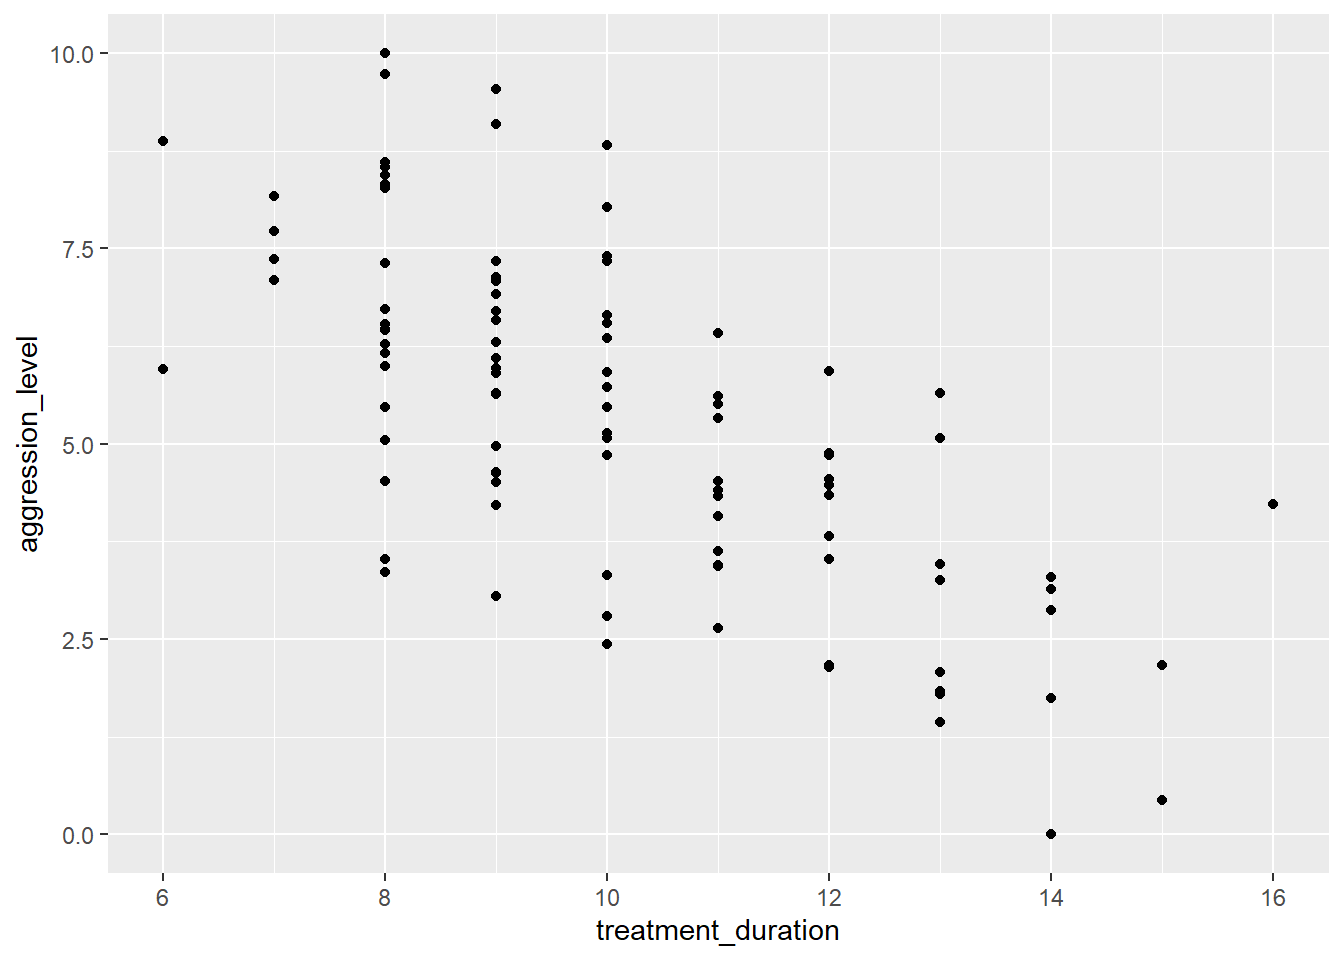
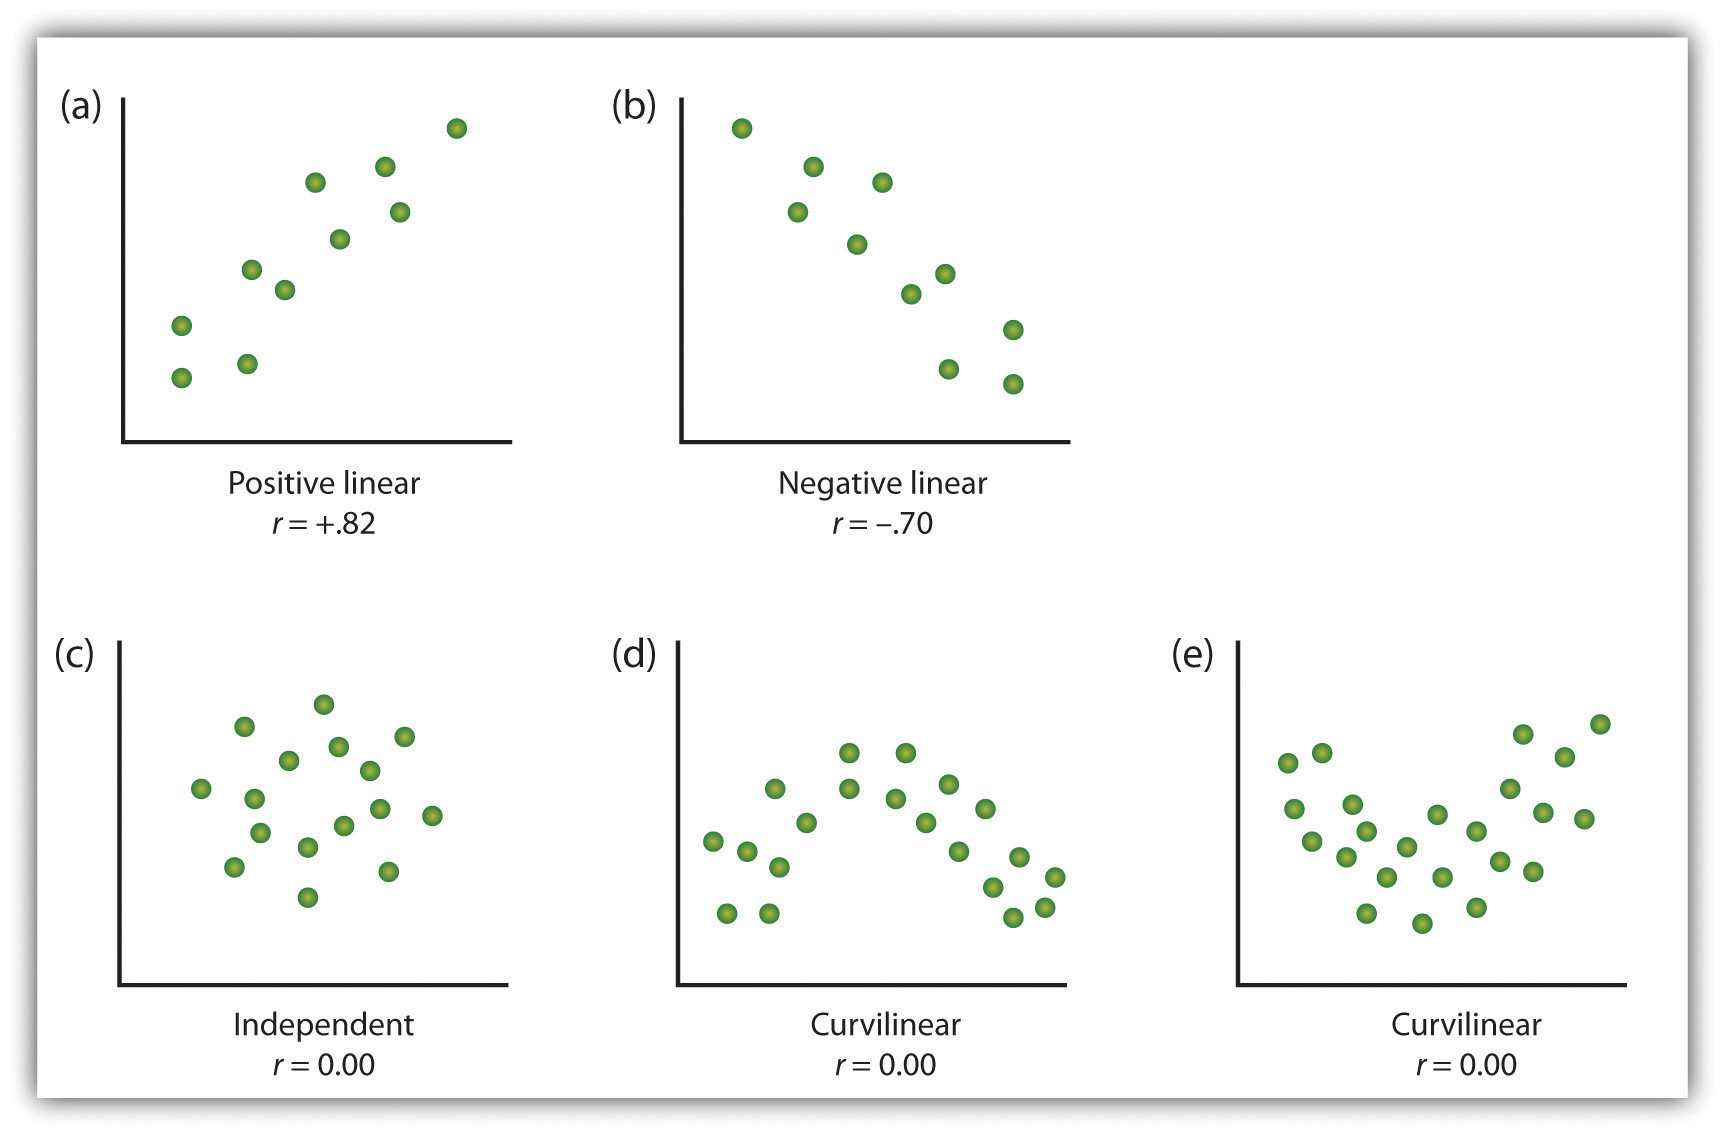
- Here we are looking to see if the relationship is linear
7.3.5 Run correlation
- R can run correlations using the cor.test() command
cor.test(regression_data$treatment_duration,regression_data$aggression_level)##
## Pearson's product-moment
## correlation
##
## data: regression_data$treatment_duration and regression_data$aggression_level
## t = -9.5503, df = 98, p-value =
## 1.146e-15
## alternative hypothesis: true correlation is not equal to 0
## 95 percent confidence interval:
## -0.7838251 -0.5765006
## sample estimates:
## cor
## -0.69429967.3.6 Check r Value (correlation value)
- The r value tells us the strength and direction of the relationship
- In the output it is labelled as “cor” (short for correlation)
cor.test(regression_data$treatment_duration,regression_data$aggression_level)##
## Pearson's product-moment
## correlation
##
## data: regression_data$treatment_duration and regression_data$aggression_level
## t = -9.5503, df = 98, p-value =
## 1.146e-15
## alternative hypothesis: true correlation is not equal to 0
## 95 percent confidence interval:
## -0.7838251 -0.5765006
## sample estimates:
## cor
## -0.69429967.3.7 Check the significance of the correlation
- We can see that the significance by looking at the p value
- The significance is 1.146^-15
- This means: 0.0000000000000001146
- Therefore p value < 0.05
cor.test(regression_data$treatment_duration,regression_data$aggression_level)##
## Pearson's product-moment
## correlation
##
## data: regression_data$treatment_duration and regression_data$aggression_level
## t = -9.5503, df = 98, p-value =
## 1.146e-15
## alternative hypothesis: true correlation is not equal to 0
## 95 percent confidence interval:
## -0.7838251 -0.5765006
## sample estimates:
## cor
## -0.6942996